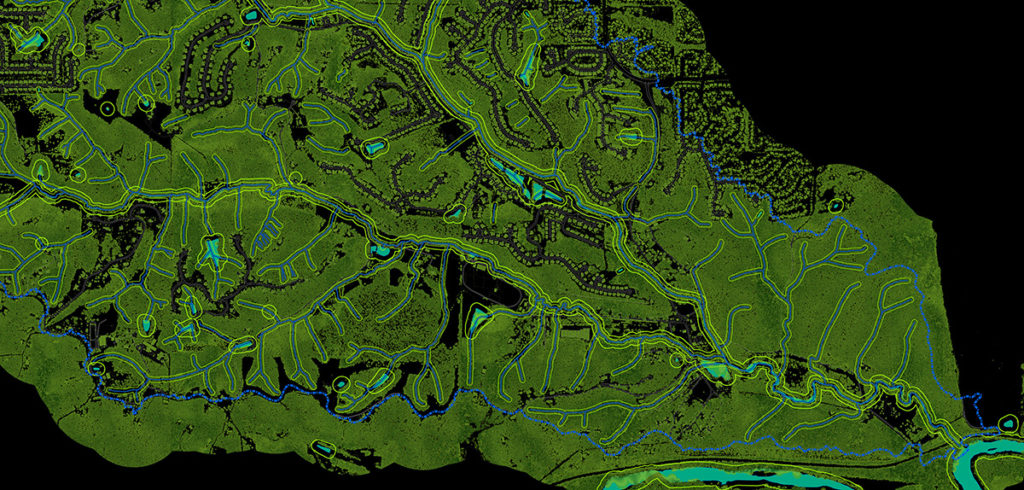
One of the most interesting tools that we are implementing to better understand the watershed and come up with insightful solutions to the water quality issues in Kiefer Creek is GIS technology. This is a screenshot from our Kiefer Creek Geodatabase, a geodatabase can be loaded with a very broad range of geospatial data.
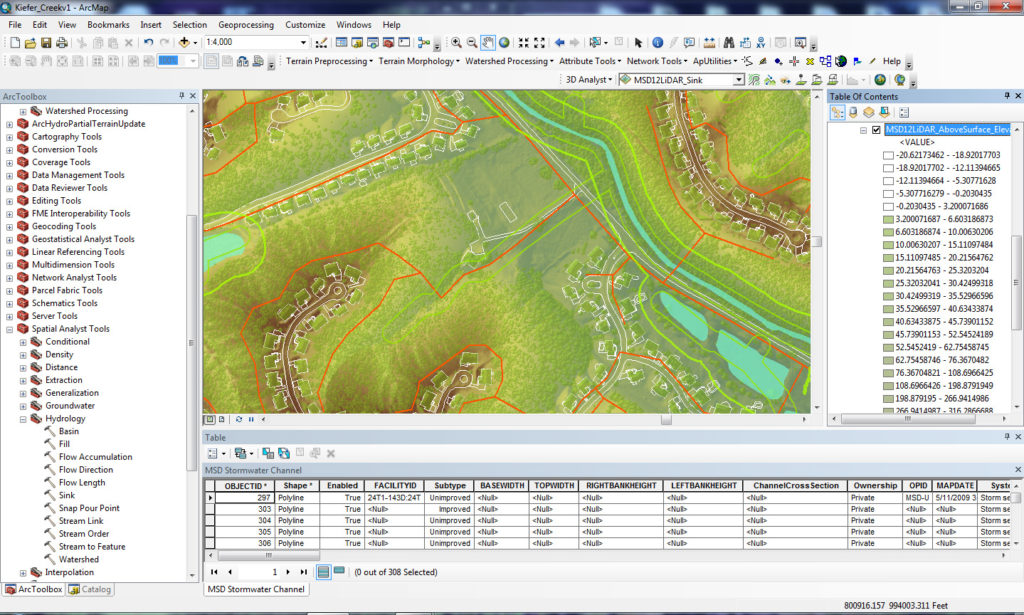
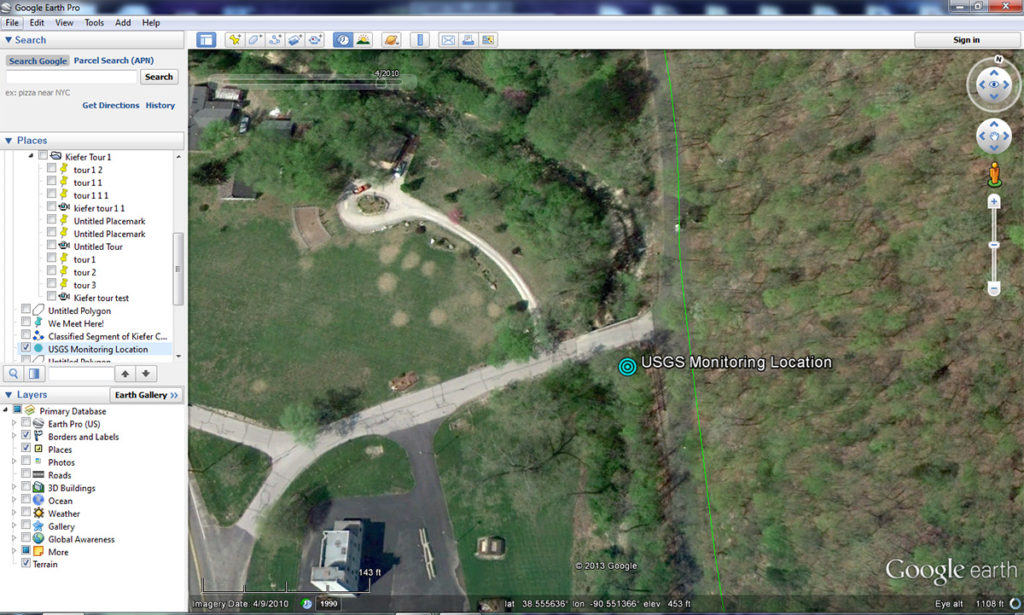
Since we started this project a few years ago, we have been collecting a wide range of GIS data from the Kiefer Creek Watershed. Geospatial data comes in many shapes and forms, like features drawn with lines and polygons or specific locations marked with points. These features can be connected to a spreadsheet of data on each specific feature, or in the case of Google Earth, the data is embedded in code associated with each feature.
Point, line, and polygon data is broadly known as vector data, in the Kiefer Creek Geodatabase this includes the delineation of the stream channel, location of springs, parcel boundaries, the watershed boundary, storm sewers, building footprints, land use and so on. The other primary form of data used in our geodatabase is known as raster data, and it is composed of a grid of pixels with values assigned to each pixel. Most poeple have become familiar with the aerial imagery found in most online mapping tools, this is raster imagery that has been projected onto a globe or flattened surface.
The location of data is recorded in longitude and latitude typically, providing accurate geographic positioning of vector features and raster datasets, however GIS software is also designed to handle three dimensional data. This allows us to create a raster where each pixel is assigned an elevation value, creating a surface model of the terrain, this is often referred to as a DEM, or Digital Elevation Model.
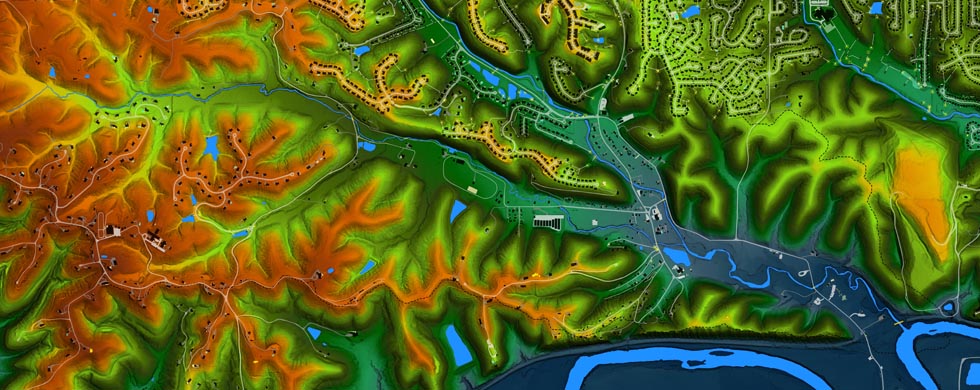
Many forms of data can be moved back and forth between vector and raster form, however there is usually one format that works better for the data you are working with. Recently we have begun to use a newly available data called LiDAR data, which stand for Light Detection and Ranging. LiDAR data is collected using lasers projected from airplanes, the place where the laser incounters something the range is determined as well as the color of the surface encountered. This information is associated with each point, and can be viewed in a GIS program like ArcGIS.
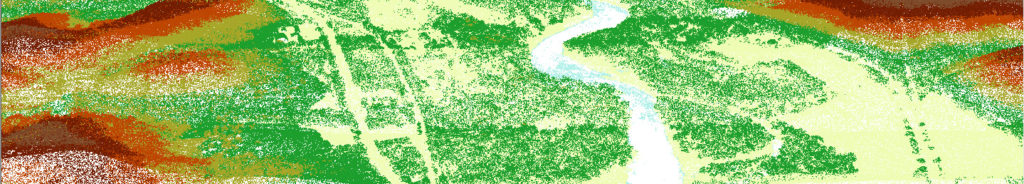
This data can be viewed as a cloud of points, also known as a point cloud, which is a three dimensional representation of all of the points collected in a LiDAR survey. These point clouds can be used to create raster surfaces representing the ground, or the height of the vegetative cover above the ground surface…

This website and other efforts related to the Kiefer Creek Restoration Project are partially funded by the Environmental Protection Agency Region 7 through the Missouri Department of Natural Resources, under Section 319 of the Clean Water Act. MoDNR Subgrant G11-NPS-21.